signal strength 2 of 5
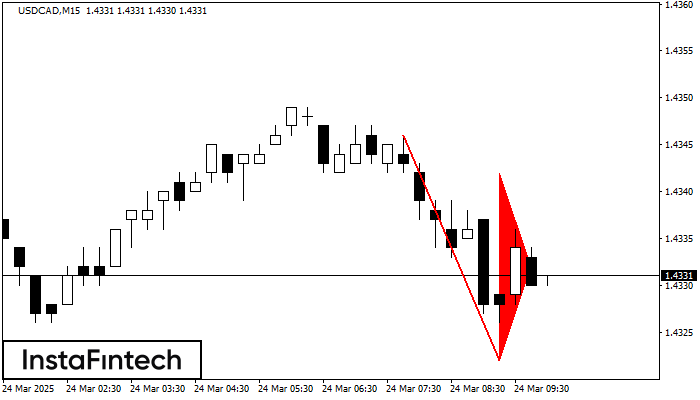
The Bearish pennant pattern has formed on the USDCAD M15 chart. This pattern type is characterized by a slight slowdown after which the price will move in the direction of the original trend. In case the price fixes below the pattern’s low of 1.4322, a trader will be able to successfully enter the sell position.
The M5 and M15 time frames may have more false entry points.
ดูเพิ่มเติม
- All
- Double Top
- Flag
- Head and Shoulders
- Pennant
- Rectangle
- Triangle
- Triple top
- All
- #AAPL
- #AMZN
- #Bitcoin
- #EBAY
- #FB
- #GOOG
- #INTC
- #KO
- #MA
- #MCD
- #MSFT
- #NTDOY
- #PEP
- #TSLA
- #TWTR
- AUDCAD
- AUDCHF
- AUDJPY
- AUDUSD
- EURCAD
- EURCHF
- EURGBP
- EURJPY
- EURNZD
- EURRUB
- EURUSD
- GBPAUD
- GBPCHF
- GBPJPY
- GBPUSD
- GOLD
- NZDCAD
- NZDCHF
- NZDJPY
- NZDUSD
- SILVER
- USDCAD
- USDCHF
- USDJPY
- USDRUB
- All
- M5
- M15
- M30
- H1
- D1
- All
- Buy
- Sale
- All
- 1
- 2
- 3
- 4
- 5
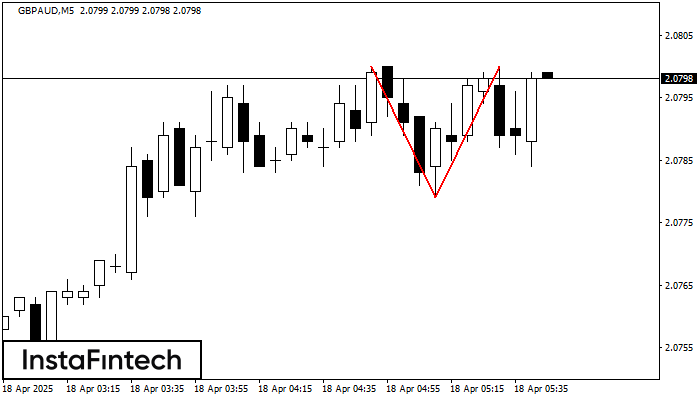
GBPAUD M5 पर डबल टॉप रीवर्सल पैटर्न बना है। विशेषताएं: ऊपरी सीमा 2.0800; निचली सीमा 2.0779; पैटर्न की चौड़ाई 21 पॉइंट्स है। सेल ट्रेडों को 2.0779 की निचली सीमा के
M5 और M15 समय सीमा में अधिक फाल्स एंट्री पॉइंट्स हो सकते हैं।
Open chart in a new window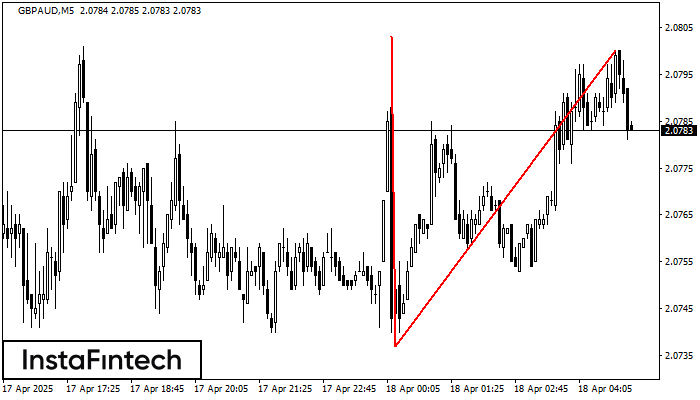
GBPAUD M5 पर डबल टॉप रीवर्सल पैटर्न बना है। विशेषताएं: ऊपरी सीमा 2.0803; निचली सीमा 2.0737; पैटर्न की चौड़ाई 63 पॉइंट्स है। सेल ट्रेडों को 2.0737 की निचली सीमा के
M5 और M15 समय सीमा में अधिक फाल्स एंट्री पॉइंट्स हो सकते हैं।
Open chart in a new window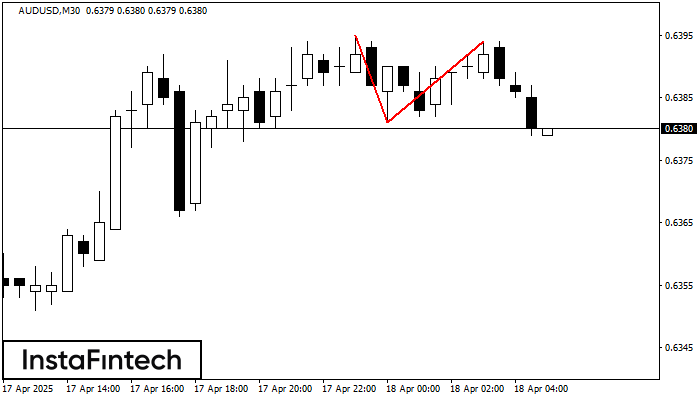
AUDUSD M30 के चार्ट पर डबल टॉप रीवर्सल पैटर्न बना है। विशेषताएं: ऊपरी सीमा 0.6394; निचली सीमा 0.6381; पैटर्न की चौड़ाई 13 पॉइंट्स। संकेत: निचली सीमा के टूटने से 0.6351
Open chart in a new window