empty
16.01.2024 03:02 PM
Trading Signals for EUR/USD on January 16-17, 2024: sell below 1.0925 (200 EMA - 1/8 Murray)

This image is no longer relevant

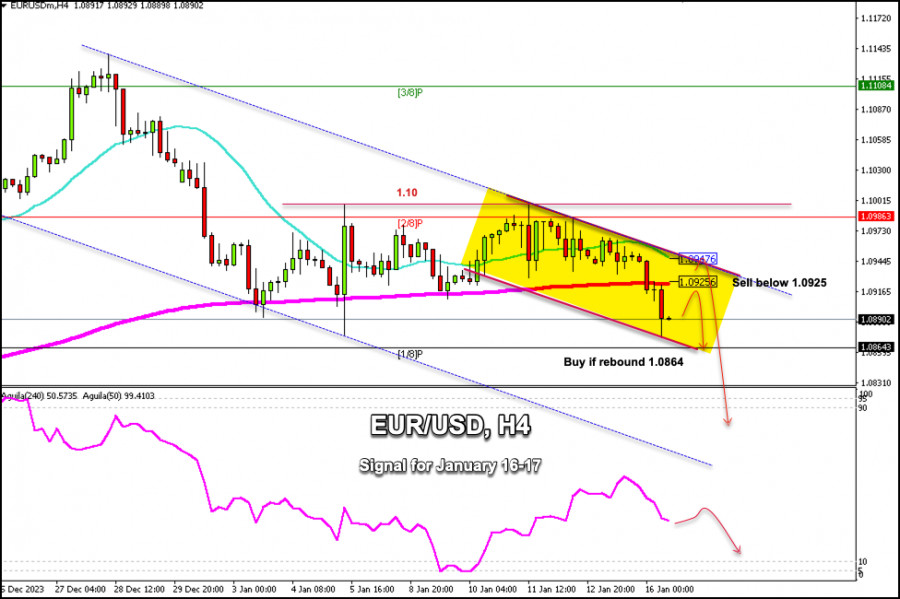
Early in the American session, the EUR/USD pair is trading around 1.0890 within a secondary downtrend channel forming since January 10 and within a primary bearish channel forming since December 26.

Since early January, the Euro has attempted to break the psychological level of 1.10, but it could not achieve it. Since then, we observed an exhaustion of the bullish force. Now EUR/USD is trading below the 200 EMA and below the 21 SMA which gives us a negative outlook for the coming days.

On the daily chart, EUR/USD has dynamic support around the 200 EMA located at 1.0813. This level will be key. If the euro falls below this level, it could be the beginning of a bearish cycle and it could reach the psychological level of 1.05 in the short term. On the other hand, if the euro rebounds around 1.0813, it will be seen as an opportunity to buy and it could return to the psychological level of 1.10.

According to the H4 chart, the euro accelerated its downward movement after breaking the 200 EMA and is expected to continue falling in the next few hours until reaching 1/8 Murray located at 1.0864. Eventually, if the bearish force prevails, EUR/USD could reach the bottom from the main downtrend channel around 1.0815.

On the contrary, if there is a technical bounce around 1.0864, it could be seen as an opportunity to buy given that this level represents the bottom of the downtrend channel and could offer an opportunity to buy.

If the euro attempts to break the downtrend channel around 1.0925 or 1.0947 and fails, it will be seen as a signal to resume selling. The eagle indicator is giving a bearish signal. So, as long as the euro trades below the psychological level of 1.10, it will be seen as a signal to sell in the coming days.

เลือกช่วงเวลา
5
นาที
15
นาที
30
นาที
1
ชั่วโมง
4
ชั่วโมง
1
วัน
1
สัปดาห์
รับผลกำไรจากการเปลี่ยนแปลงอัตราสกุลเงินดิจิทัลกับ InstaForex.
ดาวน์โหลด MetaTrader 4 และเปิดการซื้อขายครั้งแรกของคุณ.
  • Grand Choice
    Contest by
    InstaForex
    InstaForex always strives to help you
    fulfill your biggest dreams.
    เข้าร่วมการแข่งขัน


บทความแนะนำ

การพยากรณ์สำหรับ GBP/USD ในวันที่ 15 เมษายน 2025

บนชาร์ทรายการต่อชั่วโมง, คู่ GBP/USD ยังคงเพิ่มขึ้นในวันจันทร์และรักษาตำแหน่งเหนือระดับ 1.3139 ดังนั้น, การเคลื่อนไหวทางขึ้นอาจจะยังคงเป็นไปได้ไปยังระดับการแก้ไข Fibonacci ถัดไปที่ 161.8% – 1.3249 การตีกลับจากระดับนี้จะเป็นประโยชน์ต่อดอลลาร์สหรัฐฯ และนำไปสู่การลดลงไปที่ 1.3139

Samir Klishi 11:59 2025-04-15 UTC+2

การพยากรณ์สำหรับ EUR/USD วันที่ 15 เมษายน 2025

ในวันจันทร์ คู่เงิน EUR/USD ยังคงปรับตัวเพิ่มขึ้น แต่ภายในวันกลับลงมาที่ระดับ 261.8% ของ Fibonacci retracement ที่ 1.1318 การดึงกลับสองครั้งจากระดับนี้ทำให้เทรดเดอร์คาดหวังการกลับตัวที่สนับสนุนยูโรและการกลับมาเติบโตต่อไปที่ระดับ Fibonacci 323.6% ที่

Samir Klishi 11:55 2025-04-15 UTC+2

คาดการณ์ตลาด Forex วันที่ 15/04/2025: EUR/USD, GBP/USD, USD/JPY, USD/CAD และ Bitcoin

ลิงก์ที่เป็นประโยชน์: บทความอื่น ๆ ของฉันสามารถดูได้ในส่วนนี้ หลักสูตร InstaForex สำหรับผู้เริ่มต้น การวิเคราะห์ยอดนิยม เปิดบัญชีซื้อขาย ที่สำคัญ: ผู้เริ่มต้นในตลาด Forex ควรระมัดระวังอย่างมากเมื่อตัดสินใจเกี่ยวกับการเข้าสู่ตลาด ก่อนการเผยแพร่รายงานที่สำคัญ ควรจะหลีกเลี่ยงการเข้าเทรดในตลาดเพื่อลดความเสี่ยงจากความผันผวนของตลาดที่อาจเกิดขึ้นหากมีความผันผวนเพิ่มขึ้น

Sebastian Seliga 09:44 2025-04-15 UTC+2

การพยากรณ์ค่าเงิน Forex วันที่ 14/04/2025: EUR/USD, GBP/USD, USD/JPY, ทองคำ และ Bitcoin

ลิงก์ที่เป็นประโยชน์: บทความอื่น ๆ ของฉันสามารถดูได้ในหมวดนี้ คอร์สสำหรับผู้เริ่มต้นของ InstaForex การวิเคราะห์ยอดนิยม เปิดบัญชีซื้อขาย สำคัญ: ผู้เริ่มต้นในตลาดฟอเร็กซ์จำเป็นต้องระมัดระวังอย่างมากเมื่อทำการตัดสินใจเกี่ยวกับการเข้าสู่ตลาด ก่อนการประกาศรายงานสำคัญ ควรหลีกเลี่ยงการเข้าไปในตลาดเพื่อป้องกันการเผชิญกับความผันผวนที่รุนแรงจากความผันผวนที่เพิ่มขึ้น หากคุณตัดสินใจที่จะทำการซื้อขายในช่วงการประกาศข่าว ควรวางคำสั่งหยุดการซื้อขายเสมอเพื่อลดความเสี่ยงในการขาดทุน หากไม่วางคำสั่งหยุดการซื้อขาย

Sebastian Seliga 08:54 2025-04-15 UTC+2

การวิเคราะห์ทางเทคนิคของการเคลื่อนไหวของราคาภายในวันของคู่สกุลเงินข้าม EUR/JPY, วันอังคารที่ 15 เมษายน 2025

เมื่อเกิดความแตกต่าง (Divergence) ระหว่างการเคลื่อนไหวของราคาคู่สกุลเงิน EUR/JPY กับตัวชี้วัด Stochastic Oscillator และยังมีรูปแบบ Bullish 123 ตามมาด้วย Bullish Ross Hook (RH)

Arief Makmur 07:13 2025-04-15 UTC+2

การวิเคราะห์ทางเทคนิคของการเคลื่อนไหวของราคาภายในวันของคู่เงินข้ามสกุล GBP/AUD วันอังคารที่ 15 เมษายน 2025

บนกราฟ 4 ชั่วโมง คู่สกุลเงิน GBP/AUD ดูเหมือนจะเคลื่อนที่ต่ำกว่าเส้น EMA (21) และตัวบ่งชี้ Stochastic Oscillator อยู่ในสภาวะ Crossing SELL ดังนั้นในอนาคตอันใกล้

Arief Makmur 07:13 2025-04-15 UTC+2

สัญญาณการเทรดสำหรับทองคำ (XAU/USD) ระหว่างวันที่ 14-17 เมษายน 2024: ขายเมื่อราคาต่ำกว่า $3,224 (+1/8 Murray - 21 SMA)

ในช่วงต้นของสหรัฐอเมริกา ทองคำกำลังซื้อขายอยู่ที่ประมาณ 3,224 หลังจากที่ไปถึงระดับสูงสุดใหม่ที่ประมาณ 3,245.30 ขณะนี้ทองคำกำลังอยู่ในช่วงการแก้ไขทางเทคนิคและมีแนวโน้มว่าจะยังคงปรับตัวลงต่อในอีกไม่กี่ชั่วโมงข้างหน้านี้ ซึ่งอาจไปถึง 21st SMA ที่ระดับ 3,156 หากทองคำพยายามทะลุระดับ 3,245 ในอีกไม่กี่ชั่วโมงข้างหน้านี้ นี่อาจถูกมองว่าเป็นโอกาสในการขาย

Dimitrios Zappas 15:59 2025-04-14 UTC+2

การคาดการณ์สำหรับ EUR/USD ในวันที่ 14 เมษายน 2025

เมื่อวันศุกร์ คู่สกุลเงิน EUR/USD ยังคงเพิ่มขึ้น แต่ก็ลดลงในช่วงครึ่งวันหลังของวัน การลดลงนี้ (หรือการแข็งค่าของดอลลาร์) เกิดขึ้นเพียงช่วงสั้น ๆ และในตอนท้ายของวันศุกร์ ดอลลาร์สหรัฐกลับสูญเสียมูลค่าอย่างมีนัยสำคัญอีกครั้ง สถานการณ์ตลาดปัจจุบันชี้ให้เห็นว่าไม่มีอะไรหยุดดอลลาร์จากการลดค่าต่อเนื่องในแต่ละวันได้ ปัจจัยข้อมูลนั้นแรงเกินไปสำหรับนักเทรดที่จะหยุดชะงัก ณ จุดนี้พร้อมกัน

Samir Klishi 12:28 2025-04-14 UTC+2

การพยากรณ์สำหรับ GBP/USD ในวันที่ 14 เมษายน 2025

ในกราฟรายชั่วโมง คู่สกุลเงิน GBP/USD ยังคงเคลื่อนไหวในทิศทางขาขึ้นในวันศุกร์และวันนี้มีแนวโน้มจะถึงระดับ 1.3151 การเด้งกลับจากระดับนี้จะเป็นผลดีต่อดอลลาร์สหรัฐและอาจทำให้เกิดการลดลงสู่ระดับ Fibonacci 127.2% ที่ 1.3003 การทะลุอย่างชัดเจนเหนือ 1.3151 จะเพิ่มโอกาสในการเติบโตต่อเนื่องไปยังระดับการปรับฐานต่อไปที่ 1.3249 คลื่นขาขึ้นครั้งล่าสุดผ่านจุดสูงสุดเดิมไปได้

Samir Klishi 12:25 2025-04-14 UTC+2

การวิเคราะห์ทางเทคนิคของการเคลื่อนไหวของราคาสินค้าโภคภัณฑ์น้ำมันดิบประจำวันจันทร์ที่ 24 เมษายน 2025

ในกราฟ 4 ชั่วโมงของเครื่องมือสินค้าพลังงานน้ำมันดิบ พบรูปแบบ Inverted Head & Shoulders, Bullish Pattern 123 และ Divergence ระหว่างการเคลื่อนไหวของราคาน้ำมันดิบ #CL

Arief Makmur 07:19 2025-04-14 UTC+2
หากไม่สะดวกคุยในตอนนี้
ระบุคำถามไว้ได้ใน แชท.
Widget callback
 

Dear visitor,

Your IP address shows that you are currently located in the USA. If you are a resident of the United States, you are prohibited from using the services of InstaFintech Group including online trading, online transfers, deposit/withdrawal of funds, etc.

If you think you are seeing this message by mistake and your location is not the US, kindly proceed to the website. Otherwise, you must leave the website in order to comply with government restrictions.

Why does your IP address show your location as the USA?

  • - you are using a VPN provided by a hosting company based in the United States;
  • - your IP does not have proper WHOIS records;
  • - an error occurred in the WHOIS geolocation database.

Please confirm whether you are a US resident or not by clicking the relevant button below. If you choose the wrong option, being a US resident, you will not be able to open an account with InstaForex anyway.

We are sorry for any inconvenience caused by this message.