signal strength 4 of 5
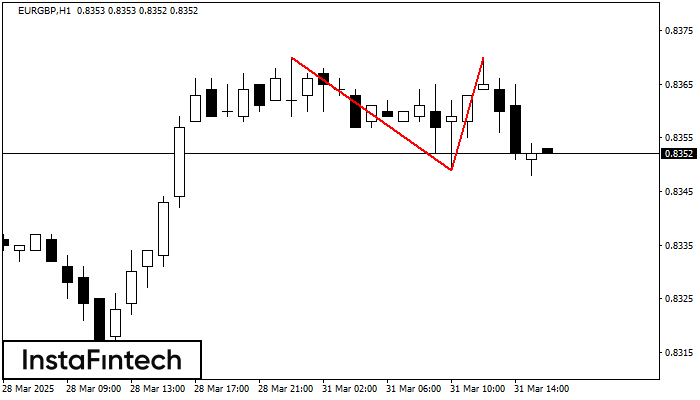
On the chart of EURGBP H1 the Double Top reversal pattern has been formed. Characteristics: the upper boundary 0.8370; the lower boundary 0.8349; the width of the pattern 21 points. The signal: a break of the lower boundary will cause continuation of the downward trend targeting the 0.8309 level.
See Also
- All
- Double Top
- Flag
- Head and Shoulders
- Pennant
- Rectangle
- Triangle
- Triple top
- All
- #AAPL
- #AMZN
- #Bitcoin
- #EBAY
- #FB
- #GOOG
- #INTC
- #KO
- #MA
- #MCD
- #MSFT
- #NTDOY
- #PEP
- #TSLA
- #TWTR
- AUDCAD
- AUDCHF
- AUDJPY
- AUDUSD
- EURCAD
- EURCHF
- EURGBP
- EURJPY
- EURNZD
- EURRUB
- EURUSD
- GBPAUD
- GBPCHF
- GBPJPY
- GBPUSD
- GOLD
- NZDCAD
- NZDCHF
- NZDJPY
- NZDUSD
- SILVER
- USDCAD
- USDCHF
- USDJPY
- USDRUB
- All
- M5
- M15
- M30
- H1
- D1
- All
- Buy
- Sale
- All
- 1
- 2
- 3
- 4
- 5
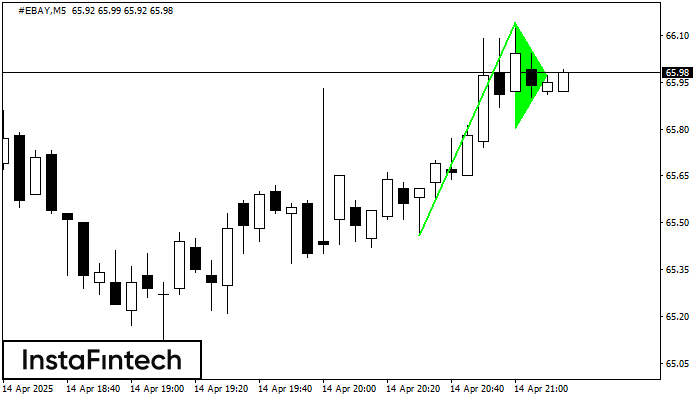
The Bullish pennant pattern is formed on the #EBAY M5 chart. It is a type of the continuation pattern. Supposedly, in case the price is fixed above the pennant’s high
The M5 and M15 time frames may have more false entry points.
Открыть график инструмента в новом окне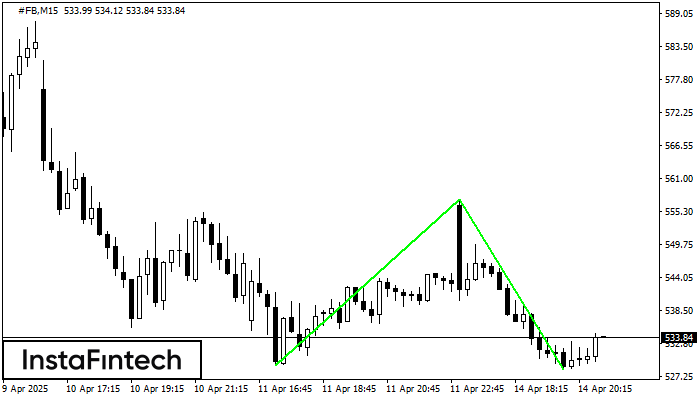
The Double Bottom pattern has been formed on #FB M15. Characteristics: the support level 529.17; the resistance level 557.42; the width of the pattern 2825 points. If the resistance level
The M5 and M15 time frames may have more false entry points.
Открыть график инструмента в новом окне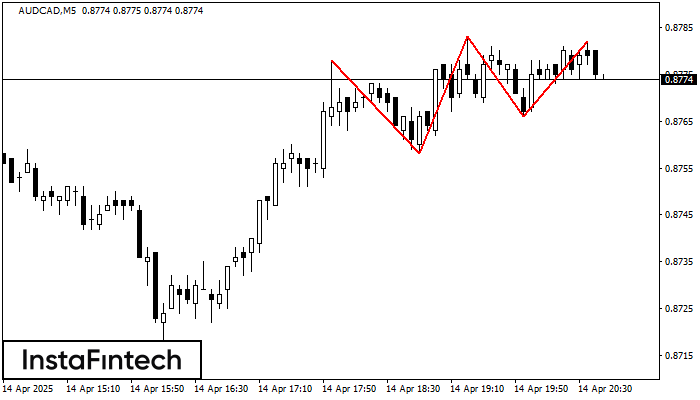
The Triple Top pattern has formed on the chart of the AUDCAD M5 trading instrument. It is a reversal pattern featuring the following characteristics: resistance level -4, support level -8
The M5 and M15 time frames may have more false entry points.
Открыть график инструмента в новом окне