empty
20.11.2023 09:42 AM
EUR/USD: indicator analysis for week from November 20 to 25

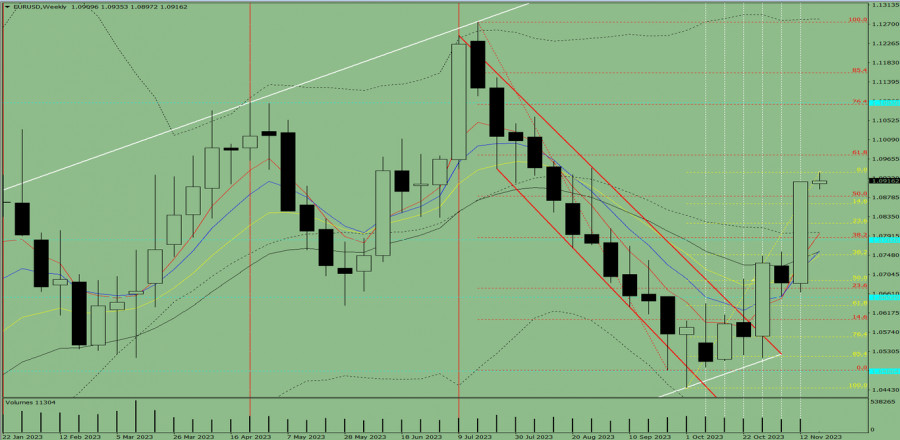
Trend-following analysis (picture 1)

This week, EUR/USD could begin the downward move from 1.0914, the closing level of the last weekly candlestick, with a target of 1.0864, the 14.6% retracement level plotted by the yellow dotted line. If this level is tested, the price could extend its upward move with a target at 1.0974, the 61.8% retracement level plotted by the red dotted line.

This image is no longer relevant

Picture 1, weekly chart

Complex analysis

  • Indicator analysis – down
  • Fibonacci levels - down
  • Trading volume – down
  • Candlestick analysis – down
  • Trend-following analysis – up
  • Bollinger bands – up
  • One-month chart – up

Complex analysis suggests the overall downtrend.

The conclusion for EUR/USD on the weekly timeframe is that the instrument is expected to follow the downtrend this week. The weekly bearish candlestick is likely to lack the first upper shadow, pointing downward on Monday. The candlestick has the second lower shadow, pointing upward on Friday.

This week, EUR/USD could begin the downward move from 1.0914, the closing level of the last weekly candlestick, with a target of 1.0864, the 14.6% retracement level plotted by the yellow dotted line. If this level is tested, the price could extend its upward move with a target at 1.0974, the 61.8% retracement level plotted by the red dotted line.

Alternative scenario. EUR/USD might start a downward move from 1.0914, the closing level of the last weekly candlestick, with a target at 1.0881 which is the 50% retracement level plotted by the red dotted line. When this level is tested, the price could reverse its trajectory upward with a target at 1.0974, the 61.8% retracement plotted by the red dotted line.

Stefan Doll,
انسٹافاریکس کا تجزیاتی ماہر
© 2007-2025
ٹائم فریم منتخب کریں
5
منٹ
15
منٹ
30
منٹ
1
گھنٹہ
4
گھنٹے
1
دن
1
ہفتہ
انسٹافاریکس کے ساتھ کرپٹو کرنسی کی معاملاتی تبدیلیوں سے کمائیں۔
میٹا ٹریڈر 4 ڈاؤن لوڈ کریں اور اپنی پہلی ٹریڈ کھولیں۔
  • Grand Choice
    Contest by
    InstaForex
    InstaForex always strives to help you
    fulfill your biggest dreams.
    مقابلہ میں شامل ہوں

تجویز کردہ مضامین

پلاٹینم کموڈٹی انسٹرومنٹ کی انٹرا ڈے پرائس موومنٹ کا تکنیکی تجزیہ، منگل 21 جنوری 2025۔

اس کے 4 گھنٹے کے چارٹ پر پلاٹینم کموڈٹی انسٹرومنٹ ابھی بھی کمزور حالت میں آگے بڑھ رہا ہے جہاں اس کی تصدیق اس کی قیمت کی حرکت سے ہوتی

Arief Makmur 12:12 2025-01-21 UTC+2

یورو / یو ایس ڈی: 20 جنوری۔ ڈالر کے لیے ایک اہم ہفتہ

پیر کو، اقتصادی واقعات کے کیلنڈر میں ایک ہی اندراج شامل ہے، لیکن اس کا امریکی ڈالر پر اہم اثر پڑ سکتا ہے۔ معلومات کا پس منظر بقیہ

Samir Klishi 15:32 2025-01-20 UTC+2

جی بی پی / یو ایس ڈی کی پیشن گوئی برائے 20 جنوری 2025

جمعہ کو، جی بی پی / یو ایس ڈی پئیر نے 1.2191 کی سطح کو مکمل طور پر نظر انداز کرتے ہوئے، گھنٹہ وار چارٹ پر تجارت جاری رکھی۔ چونکہ

Samir Klishi 15:21 2025-01-20 UTC+2

یو ایس ڈی / جے پی وائے اور یورو / جے پی وائے – تکنیکی تجزیہ کا جائزہ

پچھلے ہفتے کے آخر میں، ہم نے ہفتہ وار کنسولیڈیشن کا مشاہدہ کیا، جس کے نتیجے میں 156.07 پر ہفتہ وار اچہی موکو کلاؤڈ کی حدود میں لمبا نچلا سایہ

Evangelos Poulakis 08:56 2025-01-20 UTC+2

Bitcoin – Technical Analysis

Last year, the bulls clearly had the upper hand, achieving significant advantages and accomplishments. In 2024, they reached a new all-time high of $108,362.36, surpassing the previous peak of $68,959.73

Evangelos Poulakis 08:56 2025-01-20 UTC+2

خام تیل کے کمیوڈٹی انسٹرومنٹ کی یومیہ قیمت کی نقل و حرکت کا تکنیکی تجزیہ، پیر 20 جنوری 2025۔

یومیہ چارٹ پر، خام تیل کا کموڈٹی انسٹرومنٹ فیلنگ ویج پیٹرن کو کامیابی کے ساتھ توڑنے کے بعد دیکھا جا سکتا ہے،کروڈ آئل قیمت کی حرکت اور سٹوچاسٹک آسکیلیٹر اشارے

Arief Makmur 08:56 2025-01-20 UTC+2

جنوری 17-21 2025 کے لیے سونے (ایکس اے یو / یو ایس ڈی) کے لیے تجارتی سگنل: $2,725 سے نیچے فروخت (زیادہ خریدی گئی- 6/8 مرے)

ایگل انڈیکیٹر اوور باٹ ہونے کے اشارے دکھا رہا ہے، لہذا ہم اگلے چند دنوں میں فروخت کے مواقع تلاش کریں گے جب تک کہ سونے کی قیمت 6/8

Dimitrios Zappas 15:15 2025-01-17 UTC+2

جنوری 16-19 2025 کے لیے یورو / یو ایس ڈی کے لیے تجارتی سگنل: 1.0290 سے اوپر خریدیں (21 ایس ایم اے - 4/8 مرے)

اہم باخبر رہنا ہے۔ اگر یورو / یو ایس ڈی جوڑا 200 ای ایم اے سے اوپر مضبوط ہونے کا انتظام کرتا ہے، تو ہم رجحان میں تبدیلی کی توقع

Dimitrios Zappas 15:12 2025-01-17 UTC+2

جی بی پی / یو ایس ڈی کی پیشن گوئی برائے 15 جنوری 2025

فی گھنٹہ چارٹ پر، جی بی پی / یو ایس ڈی جوڑا یا تو اپنی اوپر کی حرکت کو بڑھانے میں ناکام رہا یا منگل کو ایک نئی کمی شروع

Samir Klishi 13:51 2025-01-15 UTC+2

یورو / یو ایس ڈی کی پیشن گوئی برائے 15 جنوری 2025

منگل کو، یورو / یو ایس ڈی پئیر 1.0255 پر 127.2% فیبوناچی ریٹریسمنٹ کی سطح سے اوپر مضبوط ہوا اور 1.0336–1.0346 پر مزاحمتی زون کی طرف اپنی اوپر کی حرکت

Samir Klishi 13:13 2025-01-15 UTC+2
ابھی فوری بات نہیں کرسکتے ؟
اپنا سوال پوچھیں بذریعہ چیٹ.
Widget callback
 

Dear visitor,

Your IP address shows that you are currently located in the USA. If you are a resident of the United States, you are prohibited from using the services of InstaFintech Group including online trading, online transfers, deposit/withdrawal of funds, etc.

If you think you are seeing this message by mistake and your location is not the US, kindly proceed to the website. Otherwise, you must leave the website in order to comply with government restrictions.

Why does your IP address show your location as the USA?

  • - you are using a VPN provided by a hosting company based in the United States;
  • - your IP does not have proper WHOIS records;
  • - an error occurred in the WHOIS geolocation database.

Please confirm whether you are a US resident or not by clicking the relevant button below. If you choose the wrong option, being a US resident, you will not be able to open an account with InstaForex anyway.

We are sorry for any inconvenience caused by this message.