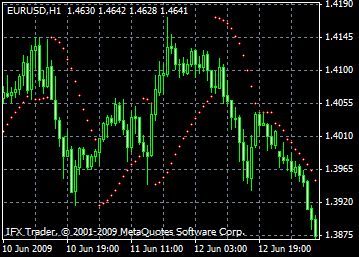
The Parabolic SAR indicator system is the technical indicator designed for analyzing market trends. The parabolic sar indicator is usually located above the price on a chart when the bearish trend prevails in the market. And vice versa, Parabolic SAR remains below the price when the market is under bull’s control.
Parabolic SAR changes direction after the price crosses its line. Consequently, further readings of the indicator will be located on the other side of the price level. At the same time, the highs and lows of the previous period serve as starting points. Reversal of Parabolic SAR indicates that the trend has terminated, and the price has entered the flat market.
This indicator enables traders to define the entry points as accurate as possible. If the price dips below the indicator’s line, it should be considered as a signal to close long trades. If the price goes above the indicator, then it is necessary to close short trades. Parabolic SAR often serves as a trailing stop.
For long deals, the reading of Parabolic SAR always increases regardless of which direction the prices goes. The pace of price movement influences the pace at which the indicator’s line shifts its position.

Calculation
SAR(i) = SAR(i-1)+ACCELERATION*(EPRICE(i-1)-SAR(i-1))
Where:
SAR(i-1) - is the value of the indicator on the previous bar;
ACCELERATION - is the acceleration factor;
EPRICE(i-1) - is the highest (lowest) price for the previous period (EPRICE=HIGH for long positions and EPRICE=LOW for short positions).
The indicator value increases if the price of the current bar is higher than previous bullish and vice versa. The acceleration factor (ACCELERATION) will double at the same time, which would cause Parabolic SAR and the price to come together. In other words, the faster the price grows or sinks, the faster the indicator approaches the price.

The InstaForex Analyst Team
GK InstaFintech © 2007-2025


