EUR/USD 5-Minute Analysis
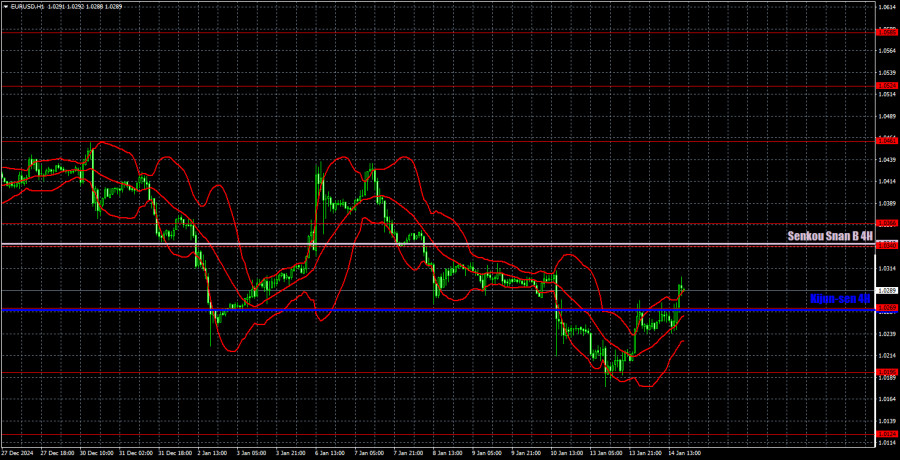
The EUR/USD currency pair continued its upward correction on Tuesday, following similar movements from the previous day. The price even settled above the critical Kijun-sen line, indicating that the euro may rise further towards the Senkou Span B line. However, ahead of Wednesday, it is prudent to avoid making bold predictions. Today, the U.S. inflation report for December will be released, which is considered one of the most critical reports alongside Non-Farm Payrolls and unemployment figures. If the market receives unexpected data, the EUR/USD pair (and possibly others) could experience significant movements in either direction. Early-year trading has shown active fluctuations, suggesting that market participants are eager to make decisions while awaiting the "resonance" of the report.
Returning to Tuesday, the downward trend remains intact across all timeframes above the hourly chart. The euro did not benefit from any positive news on either Monday or Tuesday, indicating that we are witnessing another technical correction that may conclude as soon as today. A rise of even 100 pips would not signify the end of the three-month downtrend, as the pair has consistently experienced sharp declines during this period, with recovery movements being infrequent and weak.
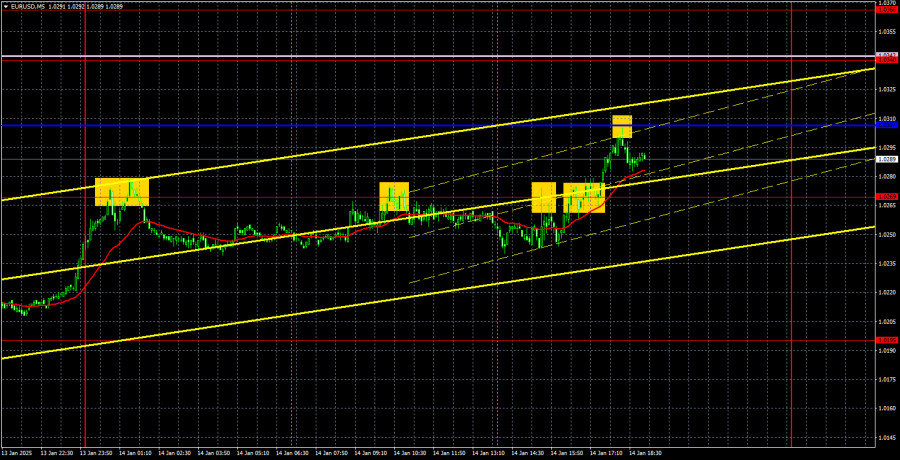
Several trading signals were generated on Tuesday, but nearly all turned out to be false. The price rebounded three times from the 1.0269 level, but each attempt failed to move even 20 pips in the desired direction. These signals duplicated each other. Eventually, the price broke above the 1.0269 level, leading to an increase towards the Kijun-sen line. This signal proved profitable but only allowed for a maximum gain of 10 pips.
COT Report
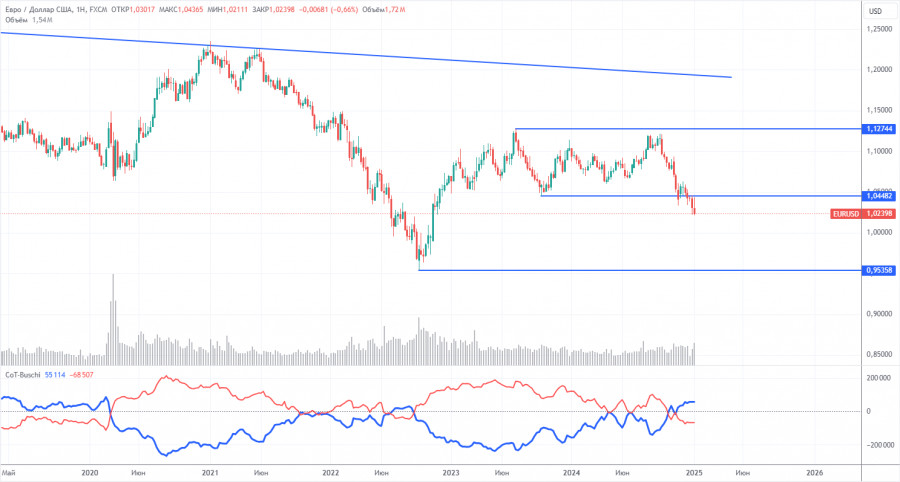
The latest Commitment of Traders (COT) report, dated December 31, indicates that non-commercial traders maintain a bullish net position. However, bears have recently gained the upper hand. Two months ago, the number of short positions among professional traders surged, resulting in a negative net position for the first time in a long while. This change suggests that the euro is being sold more frequently than it is being bought.
We have yet to identify any fundamental drivers for euro strength. From a technical perspective, the EUR/USD pair has been consolidating for quite some time. On the weekly timeframe, it has traded between 1.0448 and 1.1274 since December 2022. The breach of the 1.0448 level has opened the door for further declines.
Additionally, the COT data shows that the red and blue lines have crossed, signaling a bearish market sentiment. In the last reporting week, long positions among non-commercial traders increased by 9,300, while short positions rose by 10,400, resulting in a reduction of the net position by 1,100.
EUR/USD 1-Hour Analysis
On the hourly timeframe, the currency pair has resumed its three-month downtrend, and we believe this decline will continue in the medium term. The Federal Reserve is expected to lower rates only 1 to 2 times in 2025, which reflects a more hawkish stance than the market had anticipated. This factor, among others, will continue to support the U.S. dollar. Bearish sentiment remains prevalent below the Ichimoku indicator lines, even in the short term.
For January 15, the following levels are key for trading: 1.0124, 1.0195, 1.0269, 1.0340–1.0366, 1.0461, 1.0524, 1.0585, 1.0658–1.0669, 1.0757, 1.0797, and 1.0843, along with the Senkou Span B (1.0342) and Kijun-sen (1.0267) lines. The Ichimoku indicator lines may shift throughout the day, so it's important to consider this when identifying trading signals. Don't forget to set a stop loss at breakeven if the price moves 15 pips in your favor, which helps protect against potential losses if the signal turns out to be false.
In the Eurozone, an industrial production report will be released, which is not expected to be strong or provoke a significant market reaction. In the U.S., a more impactful report on inflation will be published. The more unexpected its actual value is, the stronger the market reaction is likely to be.
Illustration Explanations:
- Support and Resistance Levels (thick red lines): Thick red lines indicate where movement may come to an end. Please note that these lines are not sources of trading signals.
- Kijun-sen and Senkou Span B Lines: Ichimoku indicator lines transferred from the 4-hour timeframe to the hourly timeframe. These are strong lines.
- Extreme Levels (thin red lines): Thin red lines where the price has previously bounced. These serve as sources of trading signals.
- Yellow Lines: Trendlines, trend channels, or any other technical patterns.
- Indicator 1 on COT Charts: Represents the net position size for each category of traders.


