empty
07.04.2023 12:06 AM
Technical analysis of EUR/USD for April 06, 2023

This image is no longer relevant

Overview :

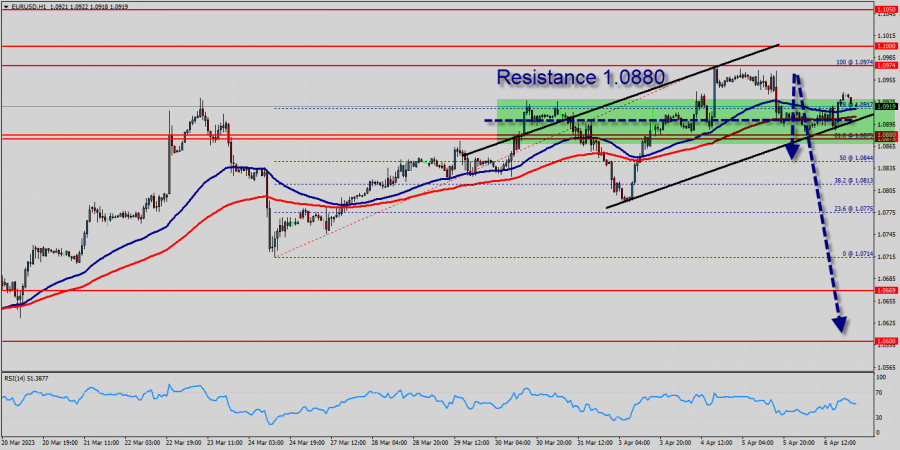
Since last week, the EUR/USD pair has faced strong resistances at the levels of 1.0880 because support had become resistance last week. So, the strong resistance has been already formed at the level of 1.0880 and the pair is likely to try to approach it in order to test it again. However, if the pair fails to pass through the level of 1.0880, the market will indicate a bearish opportunity below the new strong resistance level of 1.0880 (the level of 1.0880 coincides with a ratio of 61.8% Fibonacci - last bullish wave - double top).

Moreover, the RSI starts signaling a downward trend, as the trend is still showing strength above the moving average (100) and (50). The trend of EUR/USD pair movement was controversial as it took place in the downtrend channel. Due to the previous events, the price is still set between the levels of 1.0808 and 1.0669, so it is recommended to be careful while making deals in these levels because the prices of 1.0808 and 1.0669 are representing the resistance and support respectively.

It is necessary to wait till the downtrend channel is passed through. Then the market will probably show the signs of a bearish market. It should be noted that the volatility is very high for that the price of the EUR/USD pair is still trading between the prices of 1.0669 and 1.0808 in the coming hours. Furthermore, the price has been set below the strong resistance at the levels of 1.0808 and 1.0851 which coincide with the ratios of Fibonacci retracement levels respectively. Thus, the market is indicating a bearish opportunity below 1.0880 so it will be good to sell at 1.0808 with the first target of 1.0669.

It will also call for a downtrend in order to continue towards 1.0630. The daily strong support is seen at 1.0600. However, the stop loss should always be taken into account, for that it will be reasonable to set your stop loss at the level of 1.0851. Moving averages, in the meantime, maintain their bearish slope way above the current level.

Furthermore, although the news is bearish for the EUR/USD pair, professional may not want to sell weakness, but rather following a rebound rally. Additionally, some aggressive counter-trend buyers may be defending parity. In case a continuisions takes place and the EUR/USD pair breaks through the support level of 1.0669, a further decline to 1.0600 can occur which would indicate a bearish market.

The EUR/USD pair didn't make any significant movements yesterday. There are no changes in our technical outlook. The bias remains bearish in the nearest term testing 1.0669 or lower. Immediate support is seen around 1.0669. A clear break below that area could lead price to the neutral zone in the nearest term. Price will test 1.06030, because in general, we remain bearish on between Feb 13rd and Feb 18th, 2023. The market moved from its bottom at 1.0669 and continued to rise towards the top of 1.0680. Today, on the one-hour chart, the current rise will remain within a framework of correction.

This image is no longer relevant

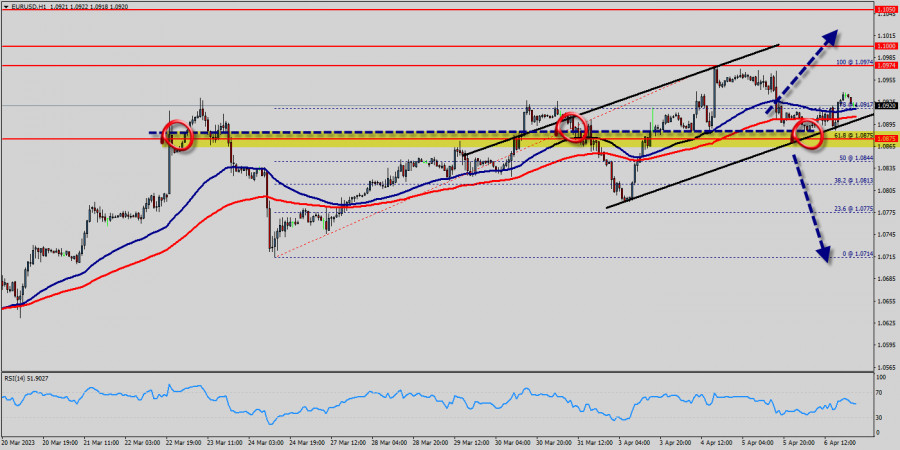
However, if the pair fails to pass through the level of 1.0732 (major resistance), the market will indicate a bearish opportunity below the strong resistance level of 1.0669 (the level of 1.0669 coincides with the ratio of 00% Fibonacci retracement - last bearish wave). This resistance has been rejected several times confirming the downtrend. Additionally, the RSI starts signaling a downward trend.

The trend is still below the 100 EMA for that the bearish outlook remains the same as long as the 100 EMA is headed to the downside. Since there is nothing new in this market, it is not bullish yet. Sell deals are recommended below the level of 1.0669 with the first target at 1.0630 so as to test the double bottom. If the trend breaks the double bottom level of 1.0600, the pair is likely to move downwards continuing the development of a bearish trend to the level of 1.0600 in order to test the weekly support 2. The third weekly support is set at the price of 1.0543.

选择时间框架
5
分钟
15
分钟
30
分钟
1
小时
4
小时
1
1
通过InstaForex赚取加密货币汇率变动的收益。
下载MetaTrader 4并开启您的第一笔交易。
  • Grand Choice
    Contest by
    InstaForex
    InstaForex always strives to help you
    fulfill your biggest dreams.
    JOIN CONTEST

推荐文章

技術分析歐元/英鎊貨幣對的日內價格走勢,2025年4月21日星期一

從4小時圖表看來,歐元對英鎊交叉匯率似乎正位於EMA(100)之上,這表明買方在該貨幣對中佔據主導地位。因此,在未來一段時間內,只要沒有回落至並收盤於0.8521水平之下的回調,歐元對英鎊具備升值潛力,並可能上升至0.8613水平。

Arief Makmur 04:19 2025-04-21 UTC+2

2025年4月21日,星期一,USD/JPY主要貨幣對的日內價格走勢技術分析。

隨著美元/日元主要貨幣對的價格走勢與隨機震盪指標的匯合,以及移動平均線(EMA 100)位於價格上方,未來美元/日元可能會繼續走弱。只要沒有進一步的上漲突破並收於149.43以上,則美元/日元將持續走弱至139.59,若波動性和走弱的動能支持,則下個目標將是137.10,該水準將接受測試並作為目標。

Arief Makmur 04:19 2025-04-21 UTC+2

外匯預測 18/04/2025:歐元/美元,英鎊/美元,黃金和比特幣

有用的連結: 我的其他文章可以在本欄目找到 InstaForex 初學者課程 受歡迎的數據分析 開設交易賬戶 重要提示: 外匯交易的初學者在決定進入市場時需格外謹慎。在重要報告發布之前,最好是避免進入市場,以免因波動性加大而遭遇劇烈的市場波動。

Sebastian Seliga 10:18 2025-04-18 UTC+2

黃金:持續的不確定性繼續支撐黃金價格

在唐納·川普發起的關稅戰未來走向不明朗的陰霾中,黃金價格持續受到支撐。 過去四個月,黃金價格幾乎呈直線上升。

Pati Gani 11:49 2025-04-17 UTC+2

2025年4月17日歐元/美元匯率預測

週三,歐元再次進入了目標區間1.1385–1.1420。然而,最近的價格走勢表明,1.1385這一水平現在似乎不再重要——我們看到一個在1.1276至1.1420之間的整固區間。

Laurie Bailey 11:07 2025-04-17 UTC+2

2025年4月17日英鎊/美元預測

昨日,英國公布了三月份的通脹數據。核心消費者物價指數(CPI)從年增率3.0%下降至2.8%,而總體CPI從年增率2.8%下降至2.6%,低於2.7%的預測值。

Laurie Bailey 11:02 2025-04-17 UTC+2

2025年4月17日USD/CAD匯率預測

在日線圖上,Marlin 振盪器顯示價格有潛在的上行逆轉可能性。下方仍有目標水平 1.3746 和價格通道下界,理論上可能在 1.3668 水準附近進行測試。

Laurie Bailey 10:59 2025-04-17 UTC+2

外匯預測 2025年4月17日:EUR/USD、NZD/USD、USD/JPY、SP500 和 Bitcoin

實用連結: 我的其他文章可以在此部分找到 InstaForex 初学者课程 熱門分析 開立交易帳戶 重要事項: 外匯交易的新手在決定進入市場時需要非常謹慎。在重要報告發布之前,最好暫時退出市場,以避免因市場波動性增加而導致的劇烈市場波動。

Sebastian Seliga 10:59 2025-04-17 UTC+2

2025年4月17日,納斯達克100指數日內價格波動的技術分析。

從納斯達克100指數的4小時圖表可觀察到幾個有趣的現象,首先,價格在移動平均線(MA100)下方波動;其次,出現了三角形圖形;第三,出現了熊市123型態,隨後伴隨著熊市 Ross Hook(RH)。根據這三個事實,近期價格有走弱的潛力,下探至17952.0的水平。

Arief Makmur 06:27 2025-04-17 UTC+2

2025年4月16日至18日黃金 (XAU/USD) 交易信號:在3,320美元下方賣出(超買 - 21 SMA)

在美國時段早盤,黃金在突破對稱三角形後,以看漲的傾向在3,312附近交易。黃金在未來幾小時內可能繼續上漲,達到3,359的7/8 Murray水平。

Dimitrios Zappas 18:20 2025-04-16 UTC+2
现在无法通话?
提出您的问题,用 在线帮助.
Widget callback
 

Dear visitor,

Your IP address shows that you are currently located in the USA. If you are a resident of the United States, you are prohibited from using the services of InstaFintech Group including online trading, online transfers, deposit/withdrawal of funds, etc.

If you think you are seeing this message by mistake and your location is not the US, kindly proceed to the website. Otherwise, you must leave the website in order to comply with government restrictions.

Why does your IP address show your location as the USA?

  • - you are using a VPN provided by a hosting company based in the United States;
  • - your IP does not have proper WHOIS records;
  • - an error occurred in the WHOIS geolocation database.

Please confirm whether you are a US resident or not by clicking the relevant button below. If you choose the wrong option, being a US resident, you will not be able to open an account with InstaForex anyway.

We are sorry for any inconvenience caused by this message.